最終更新日 : 2009.5.15
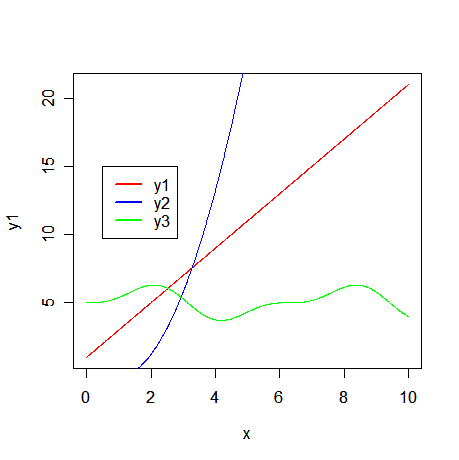
凡例を追加する
# 3つの直線・曲線を描く
x <- seq(0, 10, 0.01)
y1 <- 2*x + 1
plot(x, y1, type="l", col="red")
y2 <- 1.45*x^2 - 3*x + sqrt(x)
points(x, y2, type="l", col="blue")
y3 <- (1 -cos(x)) * sin(x) + 5
points(x, y3, type="l", col="green")

# 凡例の追加
legend(0.5, 15, # 凡例を書く座標
        c("y1", "y2", "y3"), # 凡例のラベル
        col=c("red", "blue", "green"), # 凡例のラインの色
        lwd=2 # ラインの太さ
)

legend(
    -1, 1.9,                   # 凡例を出力する座標
    c("sin", "cos", "tan"),    # ラベル
    col = c(3,4,6),            # カラーの指定
    lty = c(2, -1, 1),         # 線を引く場合は指定する 2:点線, -1:線なし, 1:実線
    pch = c(-1, 3, 4)          # データポイントの種類 別に色で指定してもよい
)