 |
第2章 回帰
p28 BOX 2.1 樹木データセットに関する分散分析と係数表
web上からダウンロードできるExcelワークシート、datasheetsch02のTreesよりデータを取り込み、データフレームを作成する。回帰分析をするためには関数lm()を使用し、それについての分散分析表はanova()、教科書で言うところの係数表はsummary()を用いる。
> dat <- excel.w(6) #Excelからデータの読み込み
Read 186 items
#データフレームの作成
> Trees <- data.frame(DIAMETER=dat[,1], HEIGHT=dat[,2], VOLUME=dat[,3],
+ LDIAM=dat[,4], LHGT=dat[,5], LVOL=dat[,6])
> Trees #データフレームの中身を表示
   DIAMETER HEIGHT VOLUME  LDIAM  LHGT  LVOL
1    0.6917     70   10.3 -0.369 4.249 2.332
2    0.7167     65   10.3 -0.333 4.174 2.332
3    0.7333     63   10.2 -0.310 4.143 2.322
4    0.8750     72   16.4 -0.134 4.277 2.797
(途中は省略)

> attach(Trees) #Treesにパスを通す
> result <- lm(VOLUME ~ HEIGHT) #回帰分析
> anova(result) #分散分析表
Analysis of Variance Table

Response: VOLUME
          Df Sum Sq Mean Sq F value    Pr(>F)
HEIGHT     1 2901.2  2901.2  16.165 0.0003784 ***
Residuals 29 5204.9   179.5
---
Signif. codes:  0 '***' 0.001 '**' 0.01 '*' 0.05 '.' 0.1 ' ' 1
> summary(result) #係数表

Call:
lm(formula = VOLUME ~ HEIGHT)

Residuals:
    Min      1Q  Median      3Q     Max
-21.274  -9.894  -2.894  12.067  29.852

Coefficients:
            Estimate Std. Error t value Pr(>|t|)
(Intercept) -87.1236    29.2731  -2.976 0.005835 **
HEIGHT        1.5433     0.3839   4.021 0.000378 ***
---
Signif. codes:  0 '***' 0.001 '**' 0.01 '*' 0.05 '.' 0.1 ' ' 1

Residual standard error: 13.4 on 29 degrees of freedom
Multiple R-Squared: 0.3579,     Adjusted R-squared: 0.3358
F-statistic: 16.16 on 1 and 29 DF,  p-value: 0.0003784
> detach(Trees) # 分析が終わったら通したパスの解除
p34 BOX 2.2 SEEDWGHTのPLANDENによる回帰分析
> dat <- excel.w(2)
> Seeds <- data.frame(PLANDEN=dat[,1], SEEDWGHT=dat[,2])
> attach(Seeds)
> result <- lm(SEEDWGHT ~ PLANDEN)
> anova(result)
> summary(result)
> detach(Seeds)
p35 BOX 2.3 MATHSのESSAYSによる回帰分析
> dat <- excel.w(2)
> Scores <- data.frame(MATHS=dat[,1], ESSAYS=dat[,2])
> attach(Scores)
> result <- lm(MATHS ~ ESSAYS)
> anova(result)
> summary(result)
> detach(Scores)
p36 BOS 2.4 SPECIES2のSPECIES1による回帰分析
> dat <- excel.w(2)
> Rodents <- data.frame(SPECIES1=dat[,1], SPECIES2=dat[,2])
> attach(Rodents)
> result <- lm(SPECIES2 ~ SPECIES1)
> anova(result)
> summary(result)
> detach(Rodents)
p43 練習問題
体重は脂肪量の多さを意味するか
> dat <- excel.w(2)
> Reduced.fats <- data.frame(WEIGHT=dat[,1], FAT=dat[,2])
> attach(Reduced.fats)
> result <- lm(FAT ~ WEIGHT)
> anova(result)
> summary(result)
> detach(Reduced.fats)
雌雄異株の樹木
> dat <- excel.w(2)
> Dio.trees <- data.frame(DBH=dat[,1], FLOWERS=dat[,2])
> attach(Dio.trees)
> result <- lm(FLOWERS ~ DBH)
> anova(result)
> summary(result)
> detach(Dio.trees)
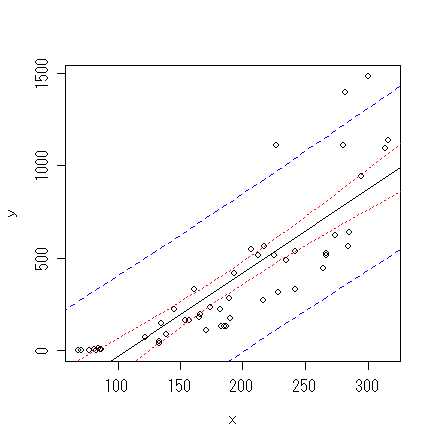
【補足】 散布図、回帰直線、信頼区間、予測区間を描く
まず次のような関数を定義する。この関数は群馬大学の青木繁信教授のwebサイト(http://aoki2.si.gunma-u.ac.jp/R/scatter.html)に掲載されている関数を改変させていただいたものです。
conf.limit <- function(x, y, alpha=0.05){
      plot(x, y)
      n <- length(x)
      b <- var(x, y)/var(x)
      a <- mean(y)-b*mean(x)
      abline(a, b)
      sx2 <- var(x)*(n-1) # SSX
      R <- max(x)-min(x)
      x1 <- seq(min(x)-R*0.1, max(x)+R*0.1, R/20) # x軸の値(=x')
      y1 <- a+b*x1
      ta <- -qt(alpha/2, n-2) # t.crit
      Ve <- (var(y)-var(x, y)^2/var(x))*(n-1)/(n-2) # MSe(=s)
      temp <- ta*sqrt(Ve)*sqrt(1/n+(x1-mean(x))^2/sx2) # 信頼区間
      y2 <- y1-temp
      lines(x1, y2, lty="dotted", col="red")
      y2 <- y1+temp
      lines(x1, y2, lty="dotted", col="red")
      temp <- ta*sqrt(Ve)*sqrt(1+1/n+(x1-mean(x))^2/sx2) # 予測区間
      y2 <- y1-temp
      lines(x1, y2, lty="dashed", col="blue")
      y2 <- y1+temp
      lines(x1, y2, lty="dashed", col="blue")
}
例えば、上の雌雄異株の樹木で用いたデータに適用してみる。
> attach(Dio.trees)
> conf.limit(DBH, FLOWERS)
> detach(Dio.trees)
 |