 |
最終更新日 : 2007.7.1
第3章 様々なモデル
Contents
 |
図の下に
Chi-Square = 0.00, df = 0, P-value = 1.00000, RMSEA = 0.000
とあるのは「構成されたパス図は正しい」という帰無仮説を検定した結果です。通常の帰無仮説の立て方とは逆になるので、この場合はp値が大きいほど良いモデルだと判断されます。
最後に記述されているRMSEAというのはカイ自乗検定とは別の指標で、これはRoot Mean Square Error of Approximationの頭文字をとっています。この値は0.05以下であると「当てはまりが良い」という判断を下します。もし0.1以上である場合は「当てはまりが良くない」と判断します。
コード中に記述されている"!"はコメントを表すマークで、"!"以降の命令は無視されます(ただし、改行するまで)。
 ! プログラムはここから
 Observed Variables
 quality price motivate
 Correlation Matrix from File 'D:\jyukaiki.dat'
 Sample Size = 250
 Relationships
 motivate = price
 motivate = quality
 price = quality
 Path Diagram
 End of Problem
 ! ここまでです

 +-----+-----+ 以下は出力結果の一部 +-----+-----+

 Sample Size =   250 サンプルサイズ


         Correlation Matrix      使用した相関行列

               price   motivate    quality
            --------   --------   --------
    price       1.00
 motivate      -0.64       1.00
  quality       0.31       0.40       1.00
 |
カイ自乗値とRMSEAの値を適合度指標として用いることはすでに述べましたが、これ以外にも代表的なものとしてGFI, AGFI, CFIという適合度指標があります。いずれの指標も値が1に近いほど「説明力のあるパス図である」と判断されます。
詳しい話は参考文献を読んでください。ここではLISRELの結果を示すだけです。
+-----+-----+ プログラムコード +-----+------+

 Observed Variables
 education earn occupation marriage
 Covariance Matrix from File 'D:\chikuji.dat'
 Sample Size = 210
 Relationships
 earn = education
 earn = occupation
 marriage = earn
 marriage = occupation
 Path Diagram
 End of Problem

+-----+-----+ サンプルサイズと分散共分散行列 +-----+-----+

 Sample Size =   210


         Covariance Matrix

                earn   marriage   educatio   occupati
            --------   --------   --------   --------
     earn     268.63
 marriage       8.05       0.49
 educatio      15.88       0.55       1.63
 occupati     104.11       4.11       8.15      83.34

+-----+-----+ 適合度指標 +-----+------+

Goodness of Fit Index (GFI) = 1.00
Adjusted Goodness of Fit Index (AGFI) = 0.97
Comparative Fit Index (CFI) = 1.00
 |
+-----+-----+ プログラムコード +-----+------+

 Observed Variables
 tsuma.chichi tsuma ot.chichi ot
 Covariance Matrix from File 'D:\hi_chikuji.dat'
 Sample Size = 300
 Relationships
 ot = ot.chichi
 ot = tsuma
 tsuma = tsuma.chichi
 tsuma = ot
 Path Diagram
 End of Problem

+-----+-----+ サンプルサイズと分散共分散行列 +-----+-----+

 Sample Size =   300


         Covariance Matrix

               tsuma         ot   tsuma.ch   ot.chich
            --------   --------   --------   --------
    tsuma       1.63
       ot       0.46       0.42
 tsuma.ch       0.52       0.13       1.49
 ot.chich       0.23       0.16       0.25       0.54

+-----+-----+ 適合度指標 +-----+------+

Goodness of Fit Index (GFI) = 1.00
Adjusted Goodness of Fit Index (AGFI) = 0.98
Comparative Fit Index (CFI) = 1.00
 |
+-----+-----+ プログラムコード +-----+------+

 Observed Variables
 V1 - V7
 Latent Variables
 F1
 Covariance Matrix from File 'D:\mimic_model.dat'
 Sample Size = 118
 Relationships
 F1 = V3 V6 V4 V7
 V5 V2 V1 = F1
 Path Diagram
 End of Problem

+-----+-----+ サンプルサイズと分散共分散行列 +-----+-----+

 Sample Size =   118


         Covariance Matrix

                  V1         V2         V5         V3         V4         V6
            --------   --------   --------   --------   --------   --------
       V1       0.85
       V2       0.16       1.76
       V5       0.37       0.47       2.01
       V3      -0.07       0.03       0.20       1.06
       V4       0.10       0.31       0.17       0.32       1.43
       V6       0.12       0.24       0.30       0.21       0.38       0.82
       V7      -0.05       0.24       0.23       0.26       0.21       0.46

         Covariance Matrix

                  V7
            --------
       V7       1.28

+-----+-----+ 適合度指標 +-----+------+

Goodness of Fit Index (GFI) = 0.98
Adjusted Goodness of Fit Index (AGFI) = 0.92
Comparative Fit Index (CFI) = 0.98
参考文献p63の図3.20にあるPLSモデルはLISRELでは扱うことができません(あくまで私が調べた範囲内での話ですが)。前回やったときも色々試行錯誤したのですがダメだったのですよねぇ。
 |
+-----+-----+ プログラムコード +-----+------+

 Observed Variables
 kokugo chiri eigo sugaku kagaku butsuri
 Latent Variables
 bunkei rikei
 Covariance Matrix from File 'D:\kakunin_inshi.dat'
 Sample Size = 100
 Relationships
 kokugo chiri eigo = bunkei
 sugaku kagaku butsuri = rikei
 Path Diagram
 End of Problem

+-----+-----+ サンプルサイズと分散共分散行列 +-----+-----+

 Sample Size =   100


         Covariance Matrix

              kokugo      chiri       eigo     sugaku     kagaku    butsuri
            --------   --------   --------   --------   --------   --------
   kokugo     123.99
    chiri      29.09     117.02
     eigo      39.26      38.61     122.97
   sugaku      10.78      30.78      26.48     221.56
   kagaku       8.52     -15.88      11.61      73.39     244.37
  butsuri      40.72      15.06      20.44      70.49      61.67     182.25

+-----+-----+ 適合度指標 +-----+------+

Goodness of Fit Index (GFI) = 0.97
Adjusted Goodness of Fit Index (AGFI) = 0.91
Comparative Fit Index (CFI) = 0.95
 |
+-----+-----+ プログラムコード +-----+------+

 Observed Variables
 V1 - V11
 Latent Variables
 F1 - F4
 Covariance Matrix from File 'D:\c03company.dat'
 Sample Size = 100
 Relationships
 V1 - V4 = F1
 V5 - V8 = F2
 V9 - V11 = F3
 F1 - F3 = F4
 Path Diagram
 End of Problem

+-----+-----+ サンプルサイズと分散共分散行列 +-----+-----+

 Sample Size =   100


         Covariance Matrix

                  V1         V2         V3         V4         V5         V6
            --------   --------   --------   --------   --------   --------
       V1       1.00
       V2       0.46       1.00
       V3       0.42       0.64       1.00
       V4       0.61       0.67       0.58       1.00
       V5       0.36       0.21       0.16       0.21       1.00
       V6       0.12       0.13       0.13       0.01       0.65       1.00
       V7       0.37       0.46       0.50       0.43       0.50       0.35
       V8       0.30       0.33       0.42       0.32       0.65       0.51
       V9       0.25       0.16       0.21       0.29       0.38       0.30
      V10       0.28       0.33       0.35       0.42       0.49       0.41
      V11       0.29       0.42       0.50       0.35       0.37       0.22

         Covariance Matrix

                  V7         V8         V9        V10        V11
            --------   --------   --------   --------   --------
       V7       1.00
       V8       0.70       1.00
       V9       0.39       0.47       1.00
      V10       0.47       0.55       0.56       1.00
      V11       0.56       0.63       0.46       0.64       1.00

+-----+-----+ 適合度指標 +-----+------+

Goodness of Fit Index (GFI) = 0.83
Adjusted Goodness of Fit Index (AGFI) = 0.73
Comparative Fit Index (CFI) = 0.94
 |
+-----+-----+ プログラムコード +-----+------+

 Observed Variables
 V1 - V11
 Latent Variables
 F1 - F4
 Covariance Matrix from File 'D:\c03company.dat'
 Sample Size = 100
 Relationships
 V1 - V4 = F1
 V5 - V8 = F2
 V9 - V11 = F3
 V1 - V11 = F4
 Path Diagram
 Let the covariance between F1 and F4 be equal to 0
 Let the covariance between F2 and F4 be equal to 0
 Let the covariance between F3 and F4 be equal to 0
 End of Problem

+-----+-----+ サンプルサイズと分散共分散行列 +-----+-----+

 (2次因子分析と同じなので省略)

+-----+-----+ 適合度指標 +-----+------+

Goodness of Fit Index (GFI) = 0.93
Adjusted Goodness of Fit Index (AGFI) = 0.84
Comparative Fit Index (CFI) = 0.98
LISRELでやってみましたがうまくいきませんでした。一応、実行させたプログラムとパス図だけ載せておきます。
 |
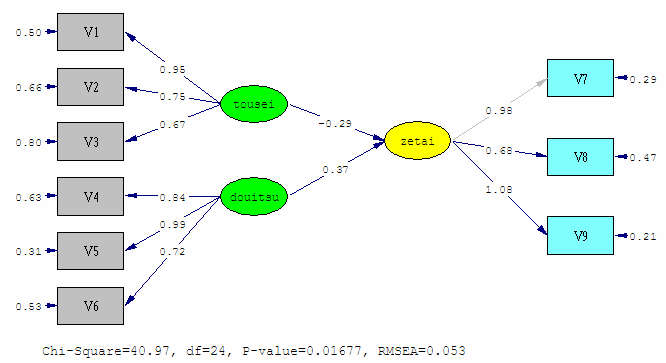
! 構成概念間の因果モデル プログラムコード
Observed Variables
        V1 - V9
Latent Variables
        tousei douitsu zetai
Covariance Matrix from File 'D:\c03mother.dat'
Sample Size = 250
Relationships
        V1 - V3 = tousei
        V4 - V6 = douitsu
        V7 - V9 = zetai
        zetai = tousei douitsu
Path Diagram
End of Problem